Project Flow Chart
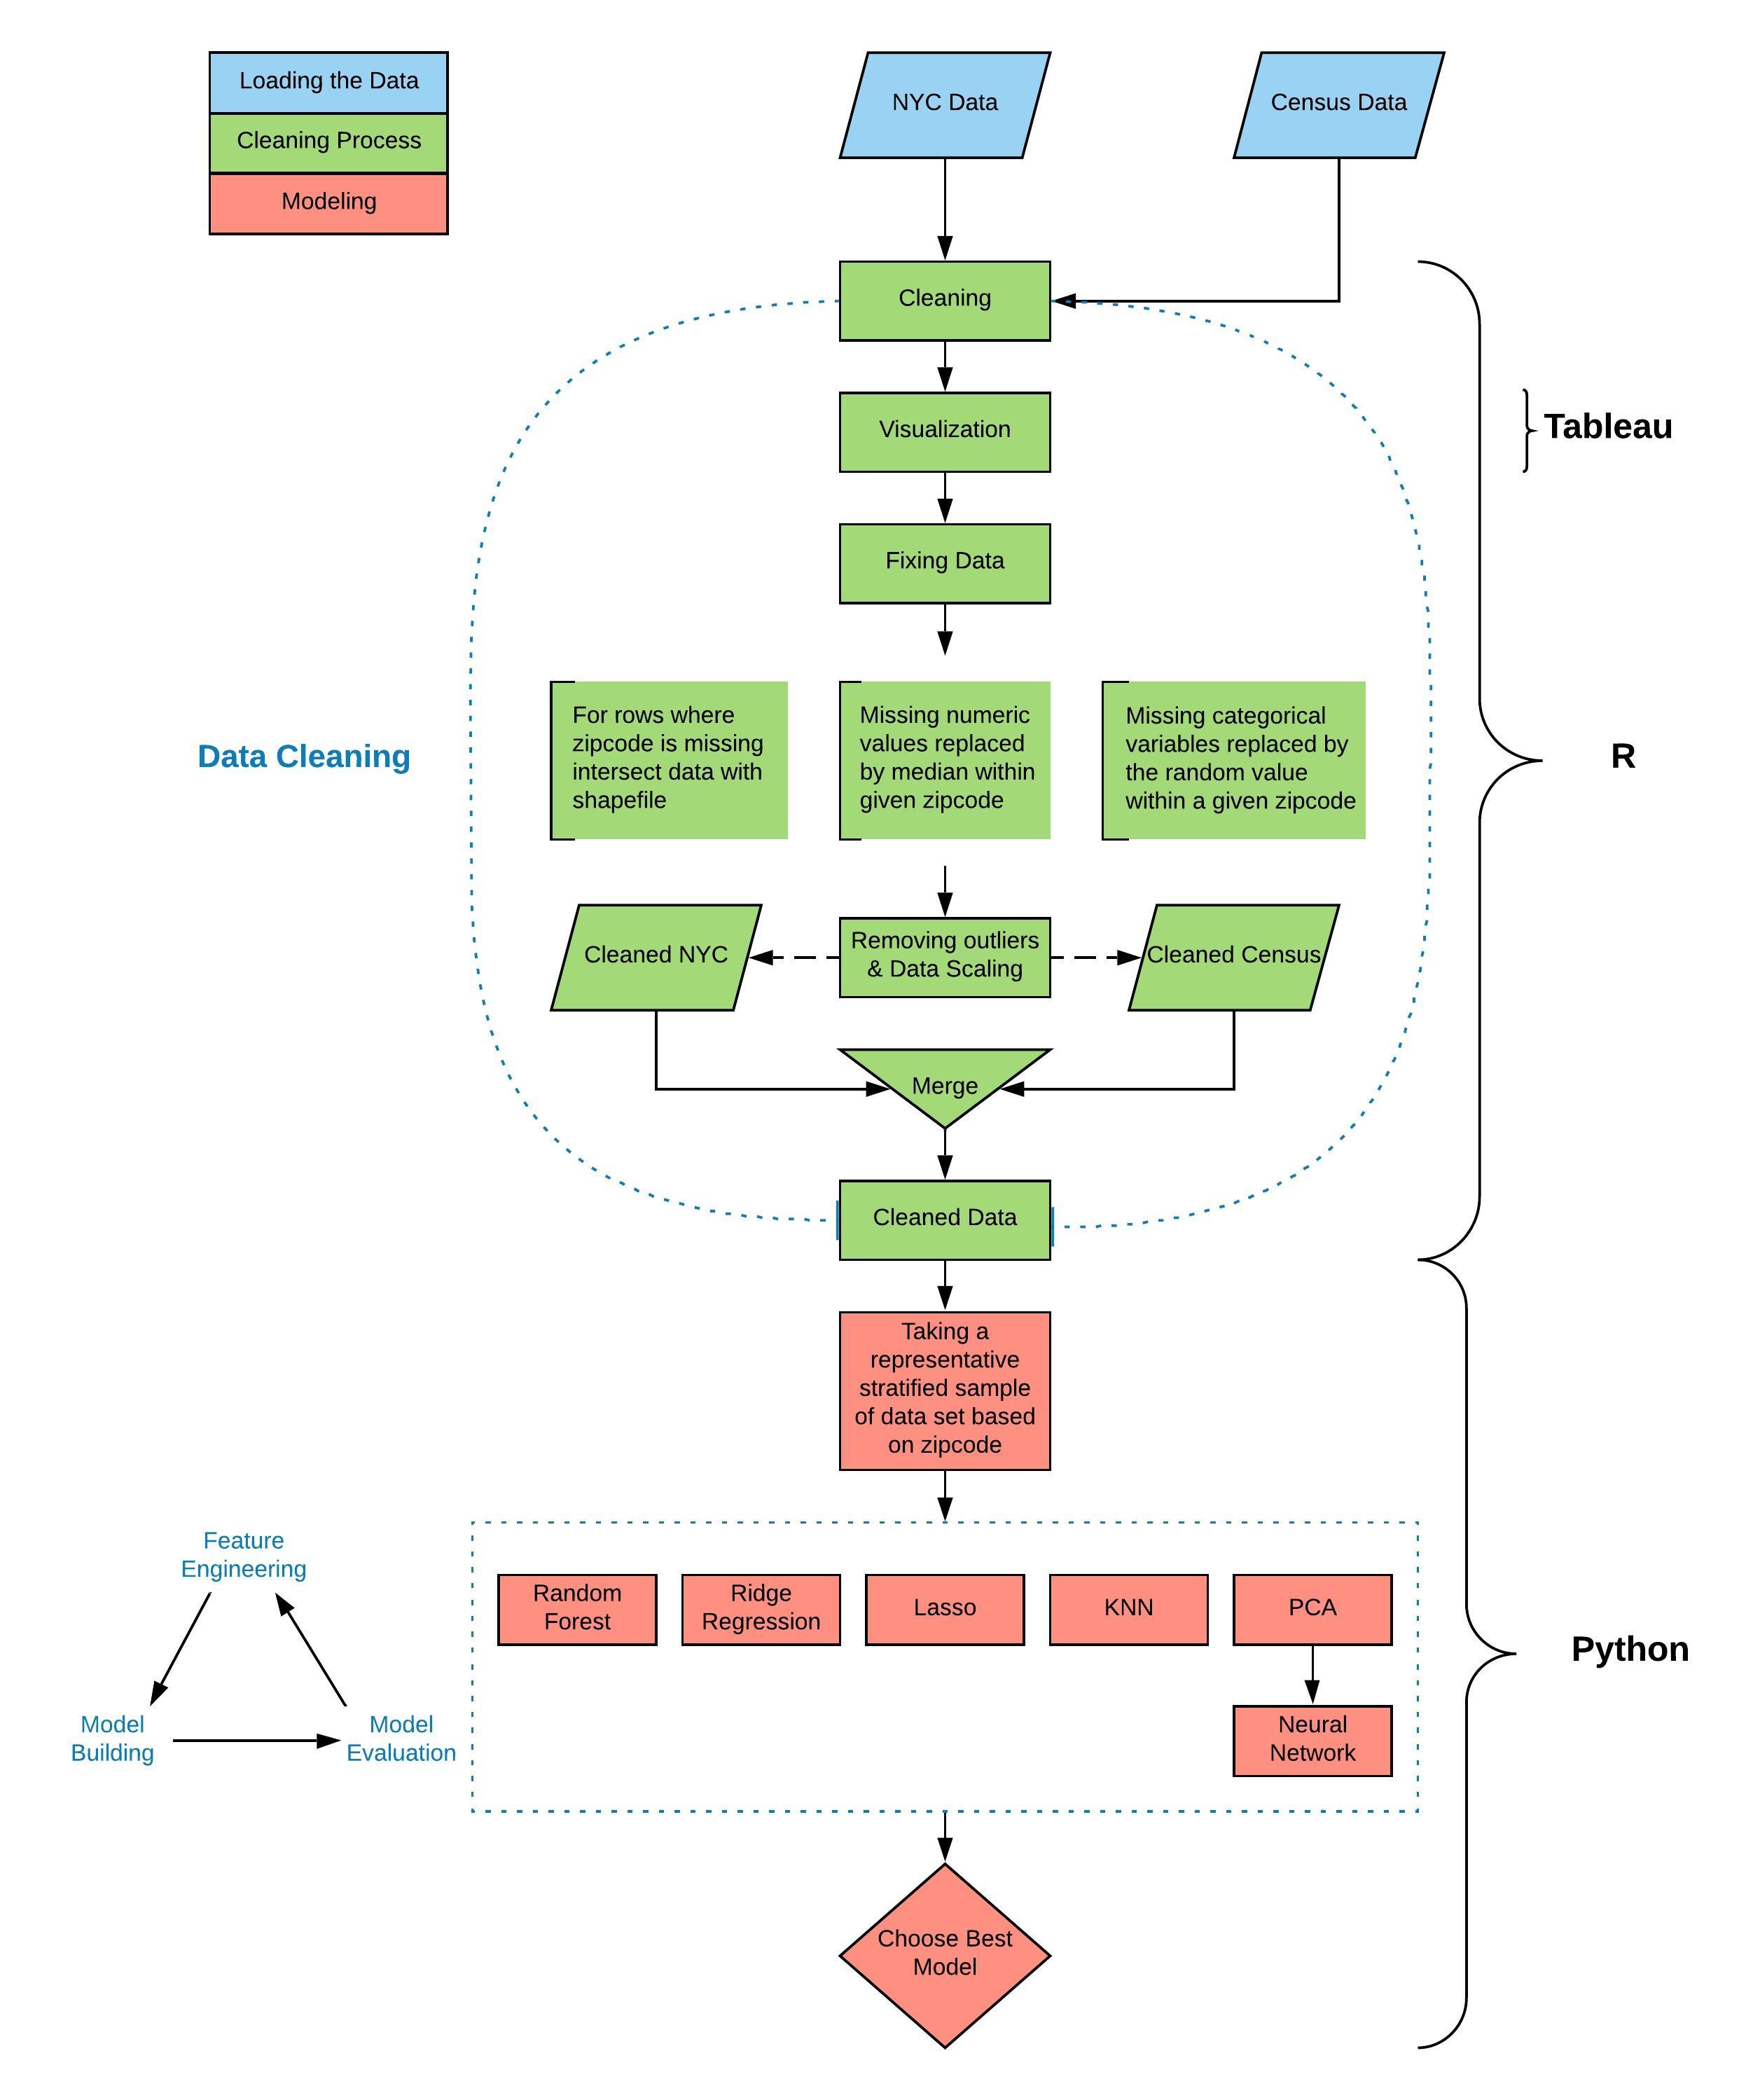
The project was done at Texas Tech University as a Capstone project by Marcin Grzechowiak, Mikaela Pisani, Roger Valdez, Arjuna Menon and Jaimie Capps. The dataset is used from the City of New York Primary Land Use Tax Lot Output (PLUTO) 2018.
Many researches have been done to evaluate property values, however all of them include in the models very detailed variables such as the number of full bathrooms, fireplaces, garage spaces, bedrooms, and more. However, the idea of this project is to predict the value of the property using data which are much easier and cheaper to access, for example, using data that are gathered for tax purposes and that are freely available online.
Two target variables were defined in the project, assessland (assessed value of the land without any buildings), and assesstot (total assessed value of the property). Since those variables are related to the market value, the results of this analysis might be widely used for many business needs.
The aim of this post is to present short version of the analysis, while the complete Report can be found on Github.
Model Comparison
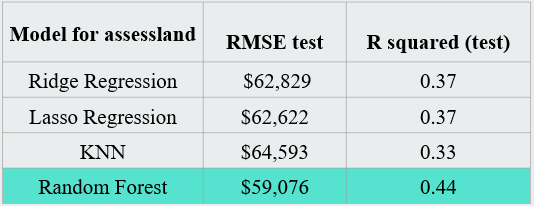
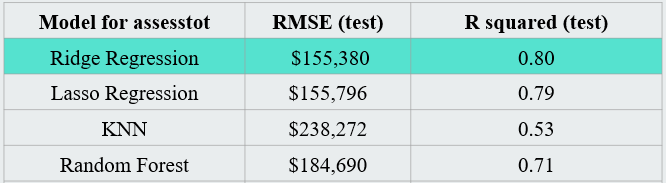
The results of all models are presented in the summary table below, where RMSE and R-square measures are compared across models. It can be seen from the table for predicting the assessed land value that the best performance with the lowest RMSE is for Random Forest. On average, the model is wrong around $59,000 based on the test set.
Best Model
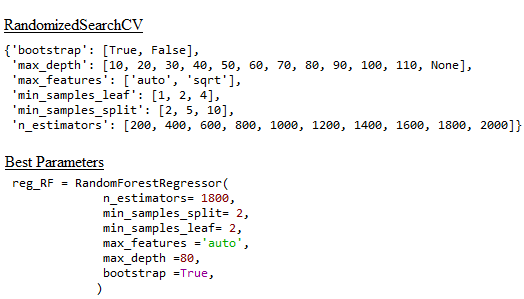
In order to determine the best parameters for Random Forest, cross-validated search over parameter settings were used. Below the list of different settings for each parameter is presented. It can be seen that there are 32 different parameters to check, so the total number of combinations is equal 1024. However, in order to improve the process, the function RandomizedSearchCV was used. The function does not try all possibilities but randomly chooses the number of specified settings given by the user, in this case 100 different parameters were checked. Best parameters are presented below.
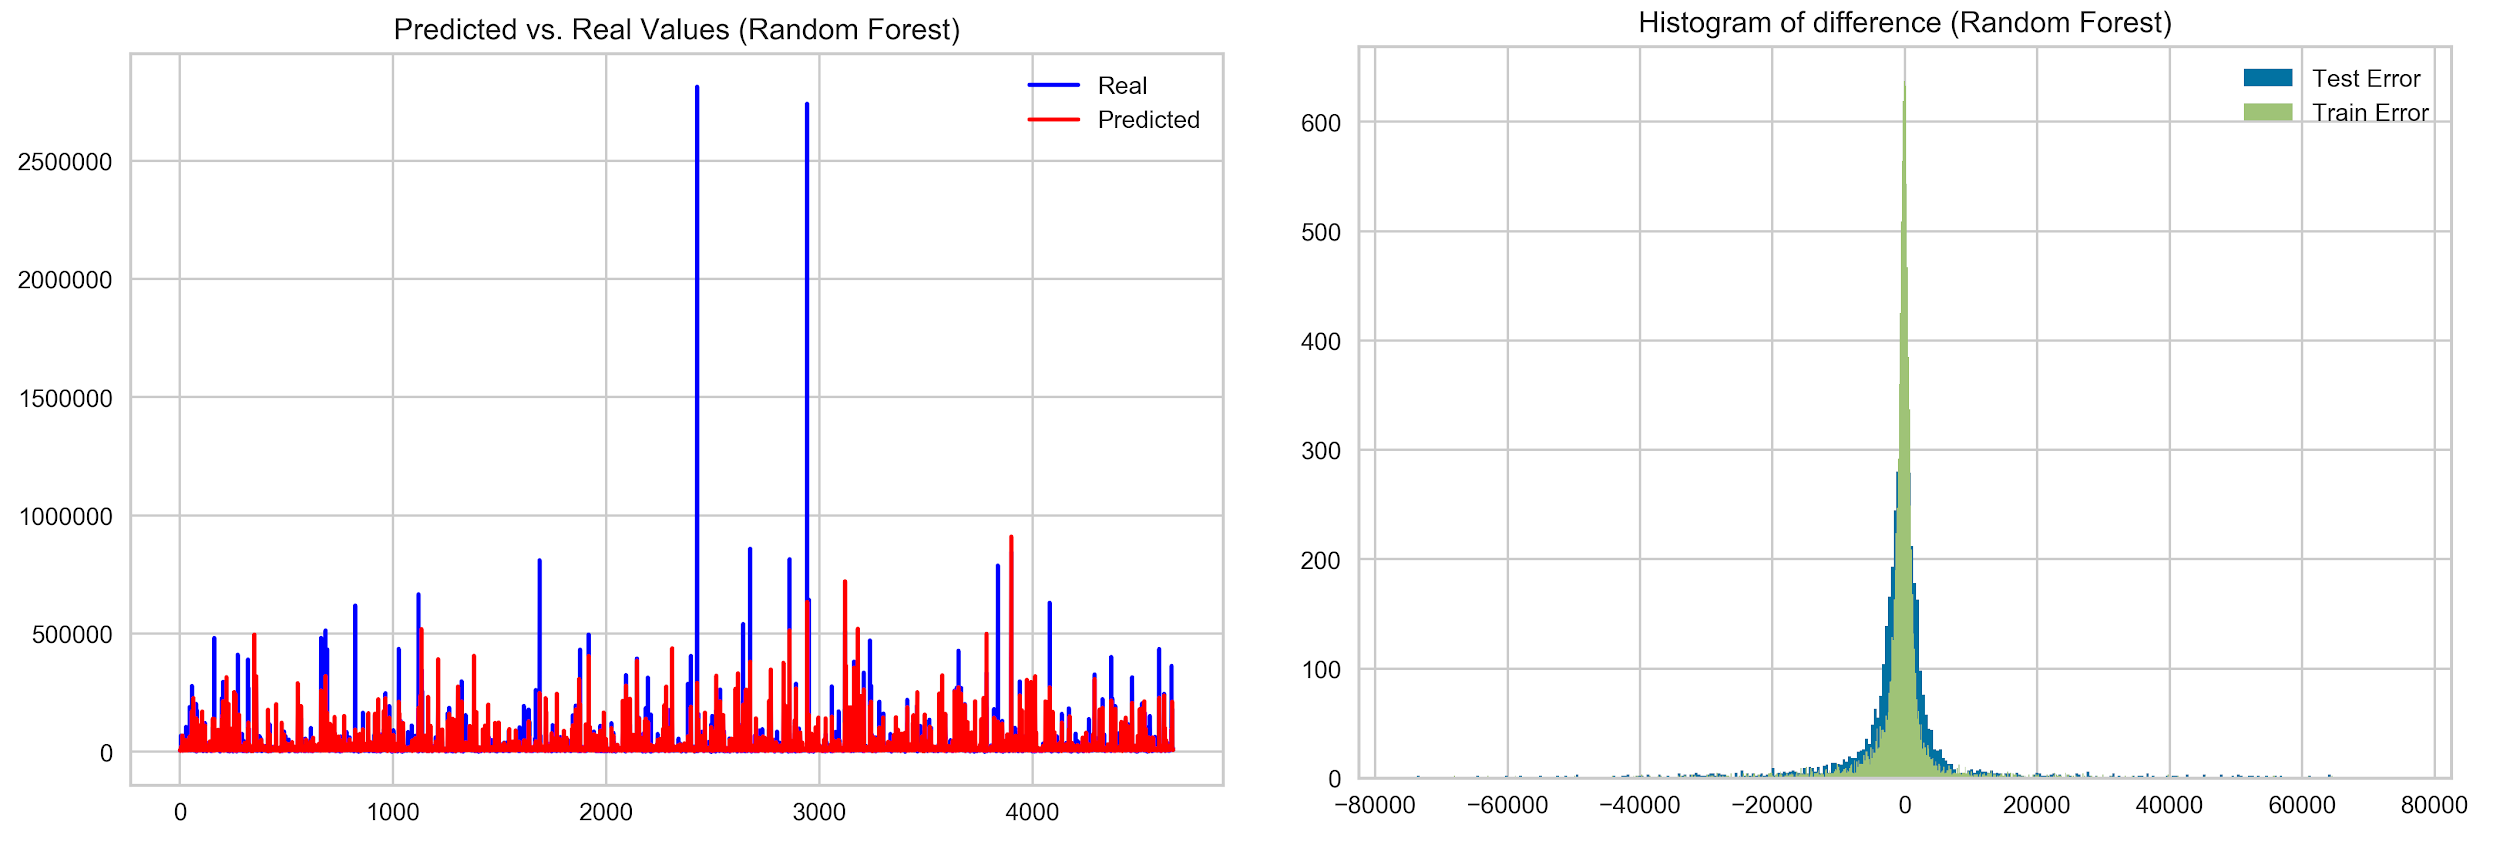
The performance of the model is described by the graphs below. Random Forest has problems with predicting very big values. However, it can be seen that the histogram for the random forest is very narrow. This means that in general, the difference between predicted values and real values is very close to zero.
Model Comparison
In the case of prediction of assessed value of the property the best performance is shown by the Ridge Regression model. On average, the model is incorrect around $155,380 based on the test set, and it is the best results among all models.
Best Model
Applying cross-validation, the best alpha was chosen as 66. Looking at the comparison of predicted against true values it can be seen that it is often similar, although there are few values for which the difference is significant.
In the case of histogram of difference, it can be seen that error ranges from -80,000 and sometimes over-predicts up to 80,000. However, many of the predicted values are placed around zero, which indicates a small error.

It can be seen that the most important predictors for assesstot are building area and the number of residential units that the land has. While a bigger building area positively influences the value of the land, the number of residential units negatively influences it. Moreover, landuse 8, which specifies land for Public Facilities & Institutions influence the value positively. On the other hand, when the type indicates Multi-Family Elevator Buildings or Mixed Residential & Commercial Buildings, the value goes down. All other variables presented in the graph describe location of tax lot.
It is recommended to use these models for initial evaluation of the property value. Businesses can make use of these models at the beginning of their deciding process in order to consider evaluating among different alternatives. However, final and crucial decision should not be based on the models’ predictions. In order to improve accuracy new data should be attached for the existing models.