The Austin Project (Business Intelligence)
Introduction
The aim of the project was to bring a few .csv files together, merged them as such the merged data set contains more valuable information than data separately. This project was done at Texas Tech University as a collaborative effort between Marcin Grzechowiak, Mikaela Pisani and Roger Valdez.
Different datasets from Austin Local Government and the U.S Government were merged together in Python and visualized in the Tableau Software. Five different data sets were used in the project:
- Mixed Beverage Gross Receipts
- Real-Time Traffic Incident Reports
- Housing Market Analysis Data by Zip Code
- Austin Water - Residential Water Consumption
- Food Establishment Inspection Scores
In order to merge mentioned above datasets, common attributes, zip-codes were used.
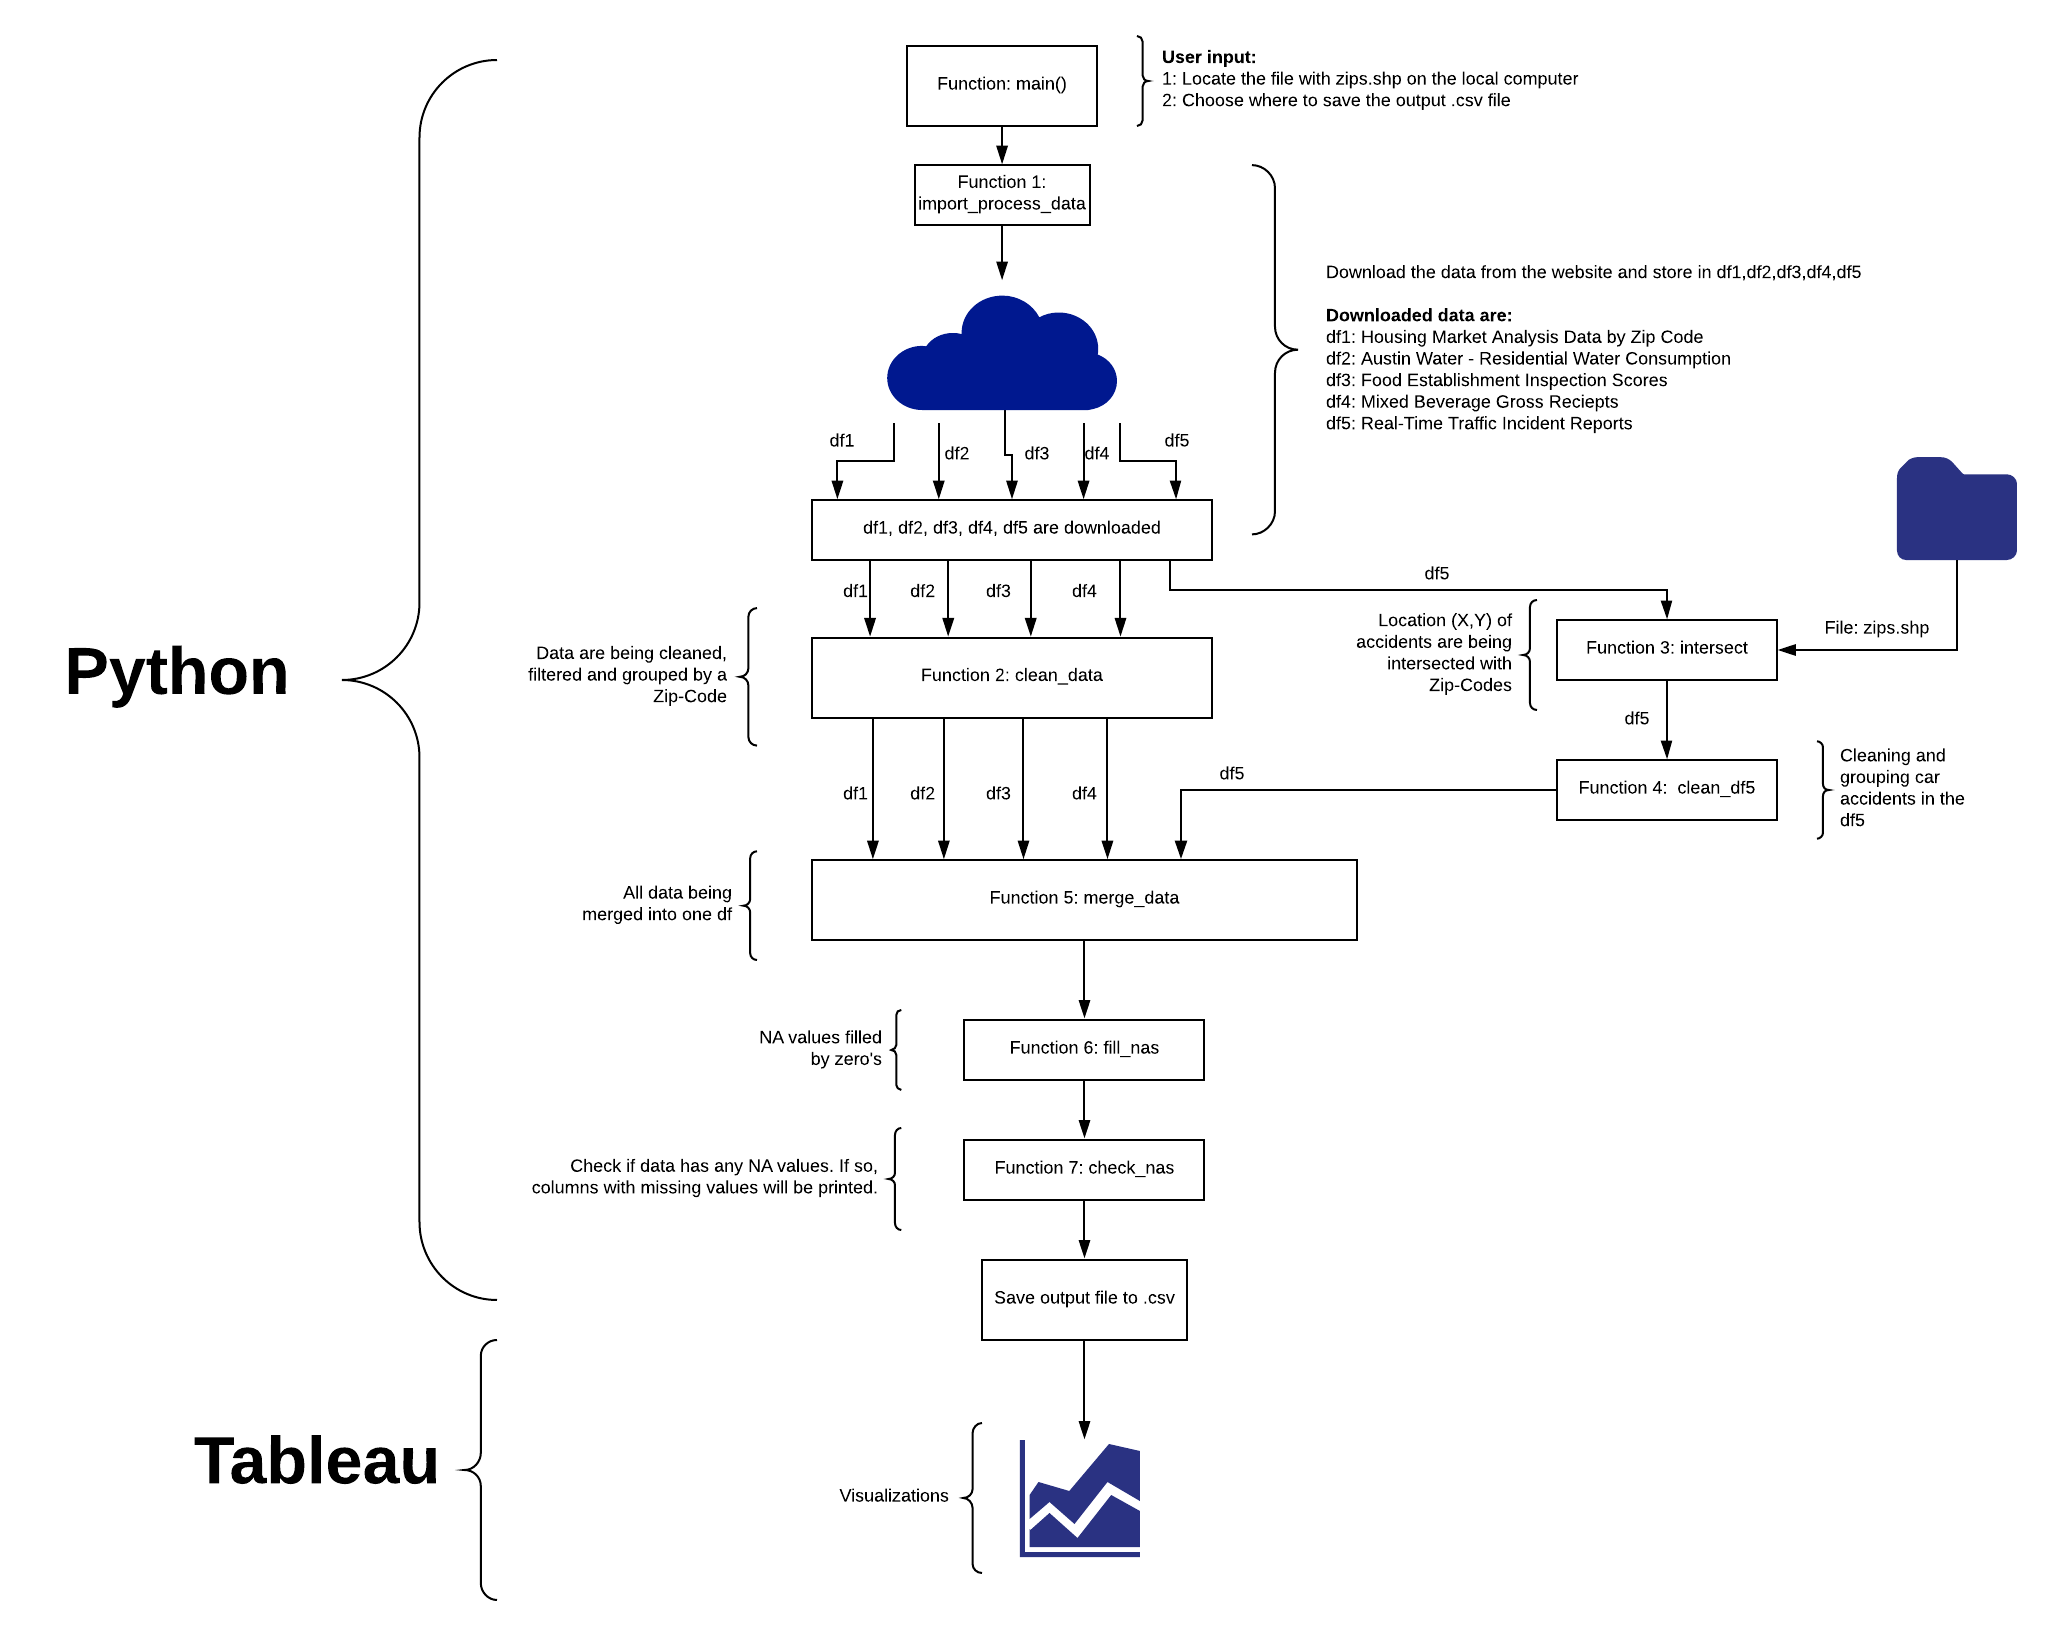
Project Flow Chart
The project consists of several functions placed in 6 different .py files. The general flow chart is presented below, while the whole code can be found here: github
Tebleau Visualizations
If the Dasboard does not render correctly on your device, use your PC and visit my Tableau Public website.